Performance Dashboard
The Performance Dashboard gives you real-time visibility into cli_debrid's CPU and memory usage. Useful for diagnosing slowdowns, memory leaks, or high resource consumption.
Access it by clicking the Uptime card on the Dashboard, or from the navigation menu.
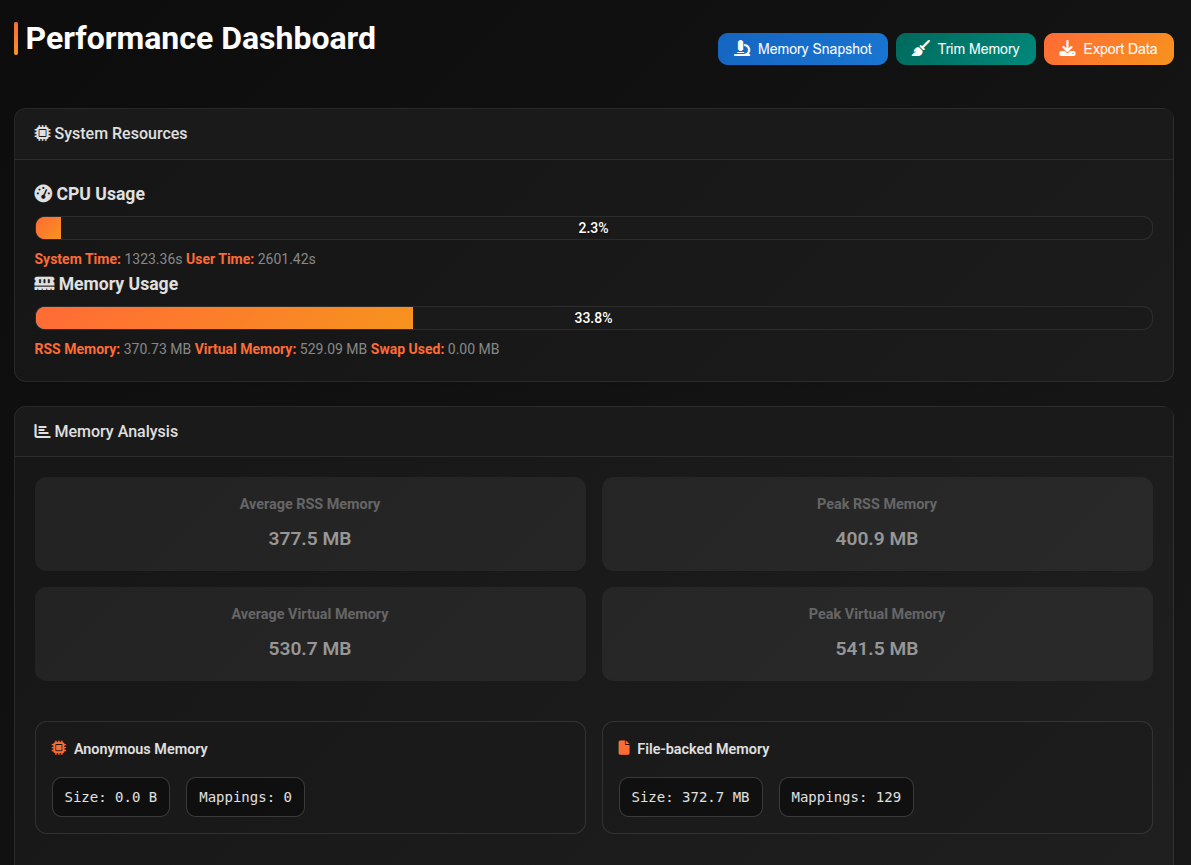
Header actions
| Button | Description |
|---|---|
| Memory Snapshot | Capture a live memory snapshot — run this while memory is high to diagnose what's consuming RAM |
| Trim Memory | Run gc.collect() + malloc_trim(0) to release glibc arena pages back to the OS. Shows before→after MB and freed MB after completing. |
| Export Data | Download the full performance data as a JSON file — useful for sharing with support or offline analysis |
System Resources
Live CPU and memory progress bars showing current usage percentage.
| Metric | Description |
|---|---|
| CPU Usage | Current CPU usage % with user time and system time breakdown |
| Memory Usage | System memory usage % with RSS, Virtual Memory, and Swap Used details |
Memory Analysis
Summary statistics calculated from the last hour of readings:
| Metric | Description |
|---|---|
| Average RSS Memory | Mean resident set size over the period |
| Peak RSS Memory | Highest RSS reading in the period |
| Average Virtual Memory | Mean virtual address space over the period |
| Peak Virtual Memory | Highest VMS reading in the period |
| Anonymous Memory | Memory not backed by a file — size and mapping count |
| File-backed Memory | Memory mapped from files — size and mapping count |
| Open Files | List of currently open file handles with path and size |
Memory Growth
A line chart showing RSS and VMS over the last hour. Also shows a snapshot table with readings at 10-minute intervals displaying RSS, VMS, and Swap at each point.
A steadily climbing RSS line indicates a potential memory leak.
| Series | Description |
|---|---|
| RSS Memory | Resident Set Size — actual RAM in use |
| Virtual Memory | Total virtual address space allocated |
Resource Handles
| Metric | Description |
|---|---|
| Open Files | Total count of open file handles |
| File Types | Distinct file extensions currently open |
CPU Profile
Historical CPU usage chart for the last hour plus a detailed summary:
| Metric | Description |
|---|---|
| Average CPU | Mean CPU usage % over the period |
| Peak CPU | Highest CPU spike in the period |
| CPU Time | Cumulative user and system time since process start |
| Active Threads | Number of running threads with per-thread user/system time and a visual bar |
Memory Snapshot
Click Memory Snapshot to capture a detailed live snapshot. The result panel shows:
| Field | Description |
|---|---|
| RSS Memory | Current resident set size |
| Virtual Memory | Current virtual memory size |
| Active Threads | Thread count at snapshot time |
| Session Store | Number of active sessions |
| Task Queue | Queued and completed task counts |
| Function Cache | Number of cached function entries |
| Scan Progress Keys | Active scan progress trackers |
| Analysis Progress Keys | Active analysis progress trackers |
| Notification Queues | Number of notification queues |
| Top Python Object Types | Table of the most numerous Python object types by count — useful for identifying memory leaks |
| Thread Names | Expandable list of all active thread names |
Click Download in the snapshot panel to save it as a JSON file.
Auto-refresh
The dashboard refreshes automatically every 60 seconds.
Healthy baselines
For reference, typical memory usage:
| State | Expected RSS |
|---|---|
| Cold start (no activity) | ~280–300 MB |
| Warm idle (after running) | ~350–400 MB |
| Active scraping | ~400–500 MB |